AI coding tools have turned "writing code" into a near-zero-cost action, but every PR still has to run through CI. The Linear engineering team found that their test suite had ballooned to 4 times its original size this year, pushing PR wait times past 6 minutes. They rebuilt this pipeline with 4 moves: swapping to a third-party runner, compressing the change detection gate, cutting redundant startup overhead, and switching to a native compiler—bringing PR wait time back down to around 5 minutes.
AI made coding free; CI is the new queue
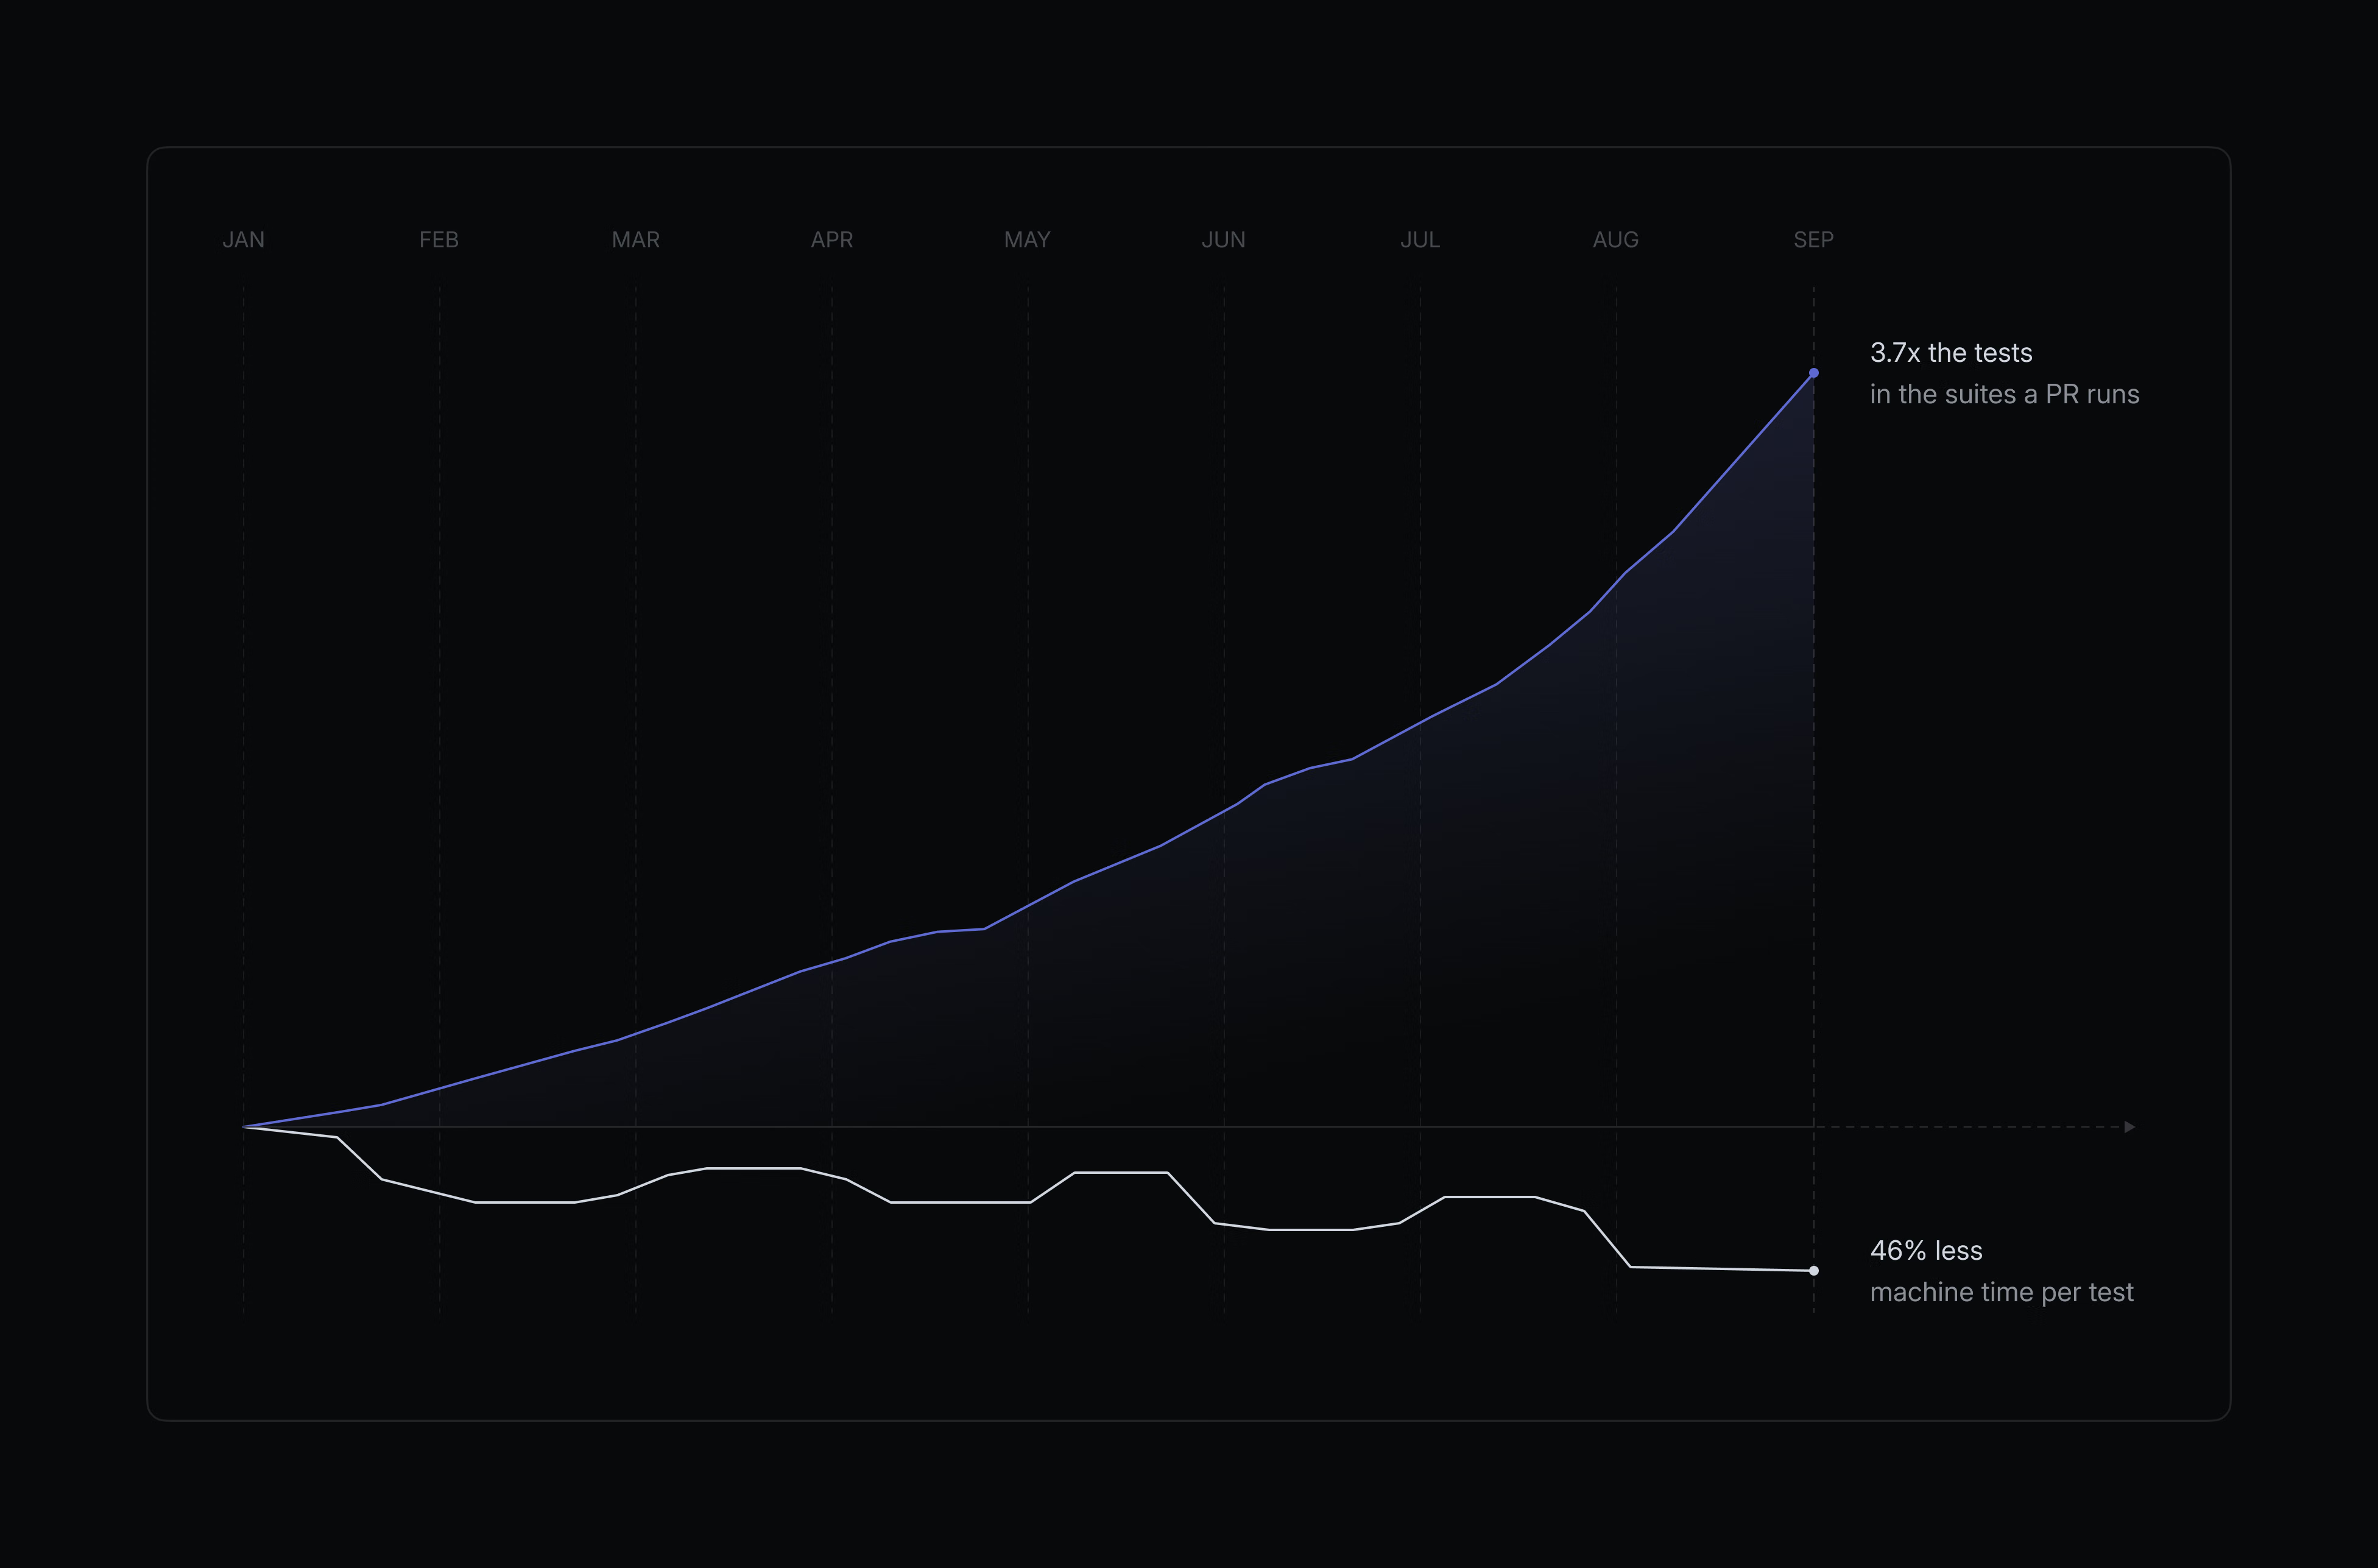
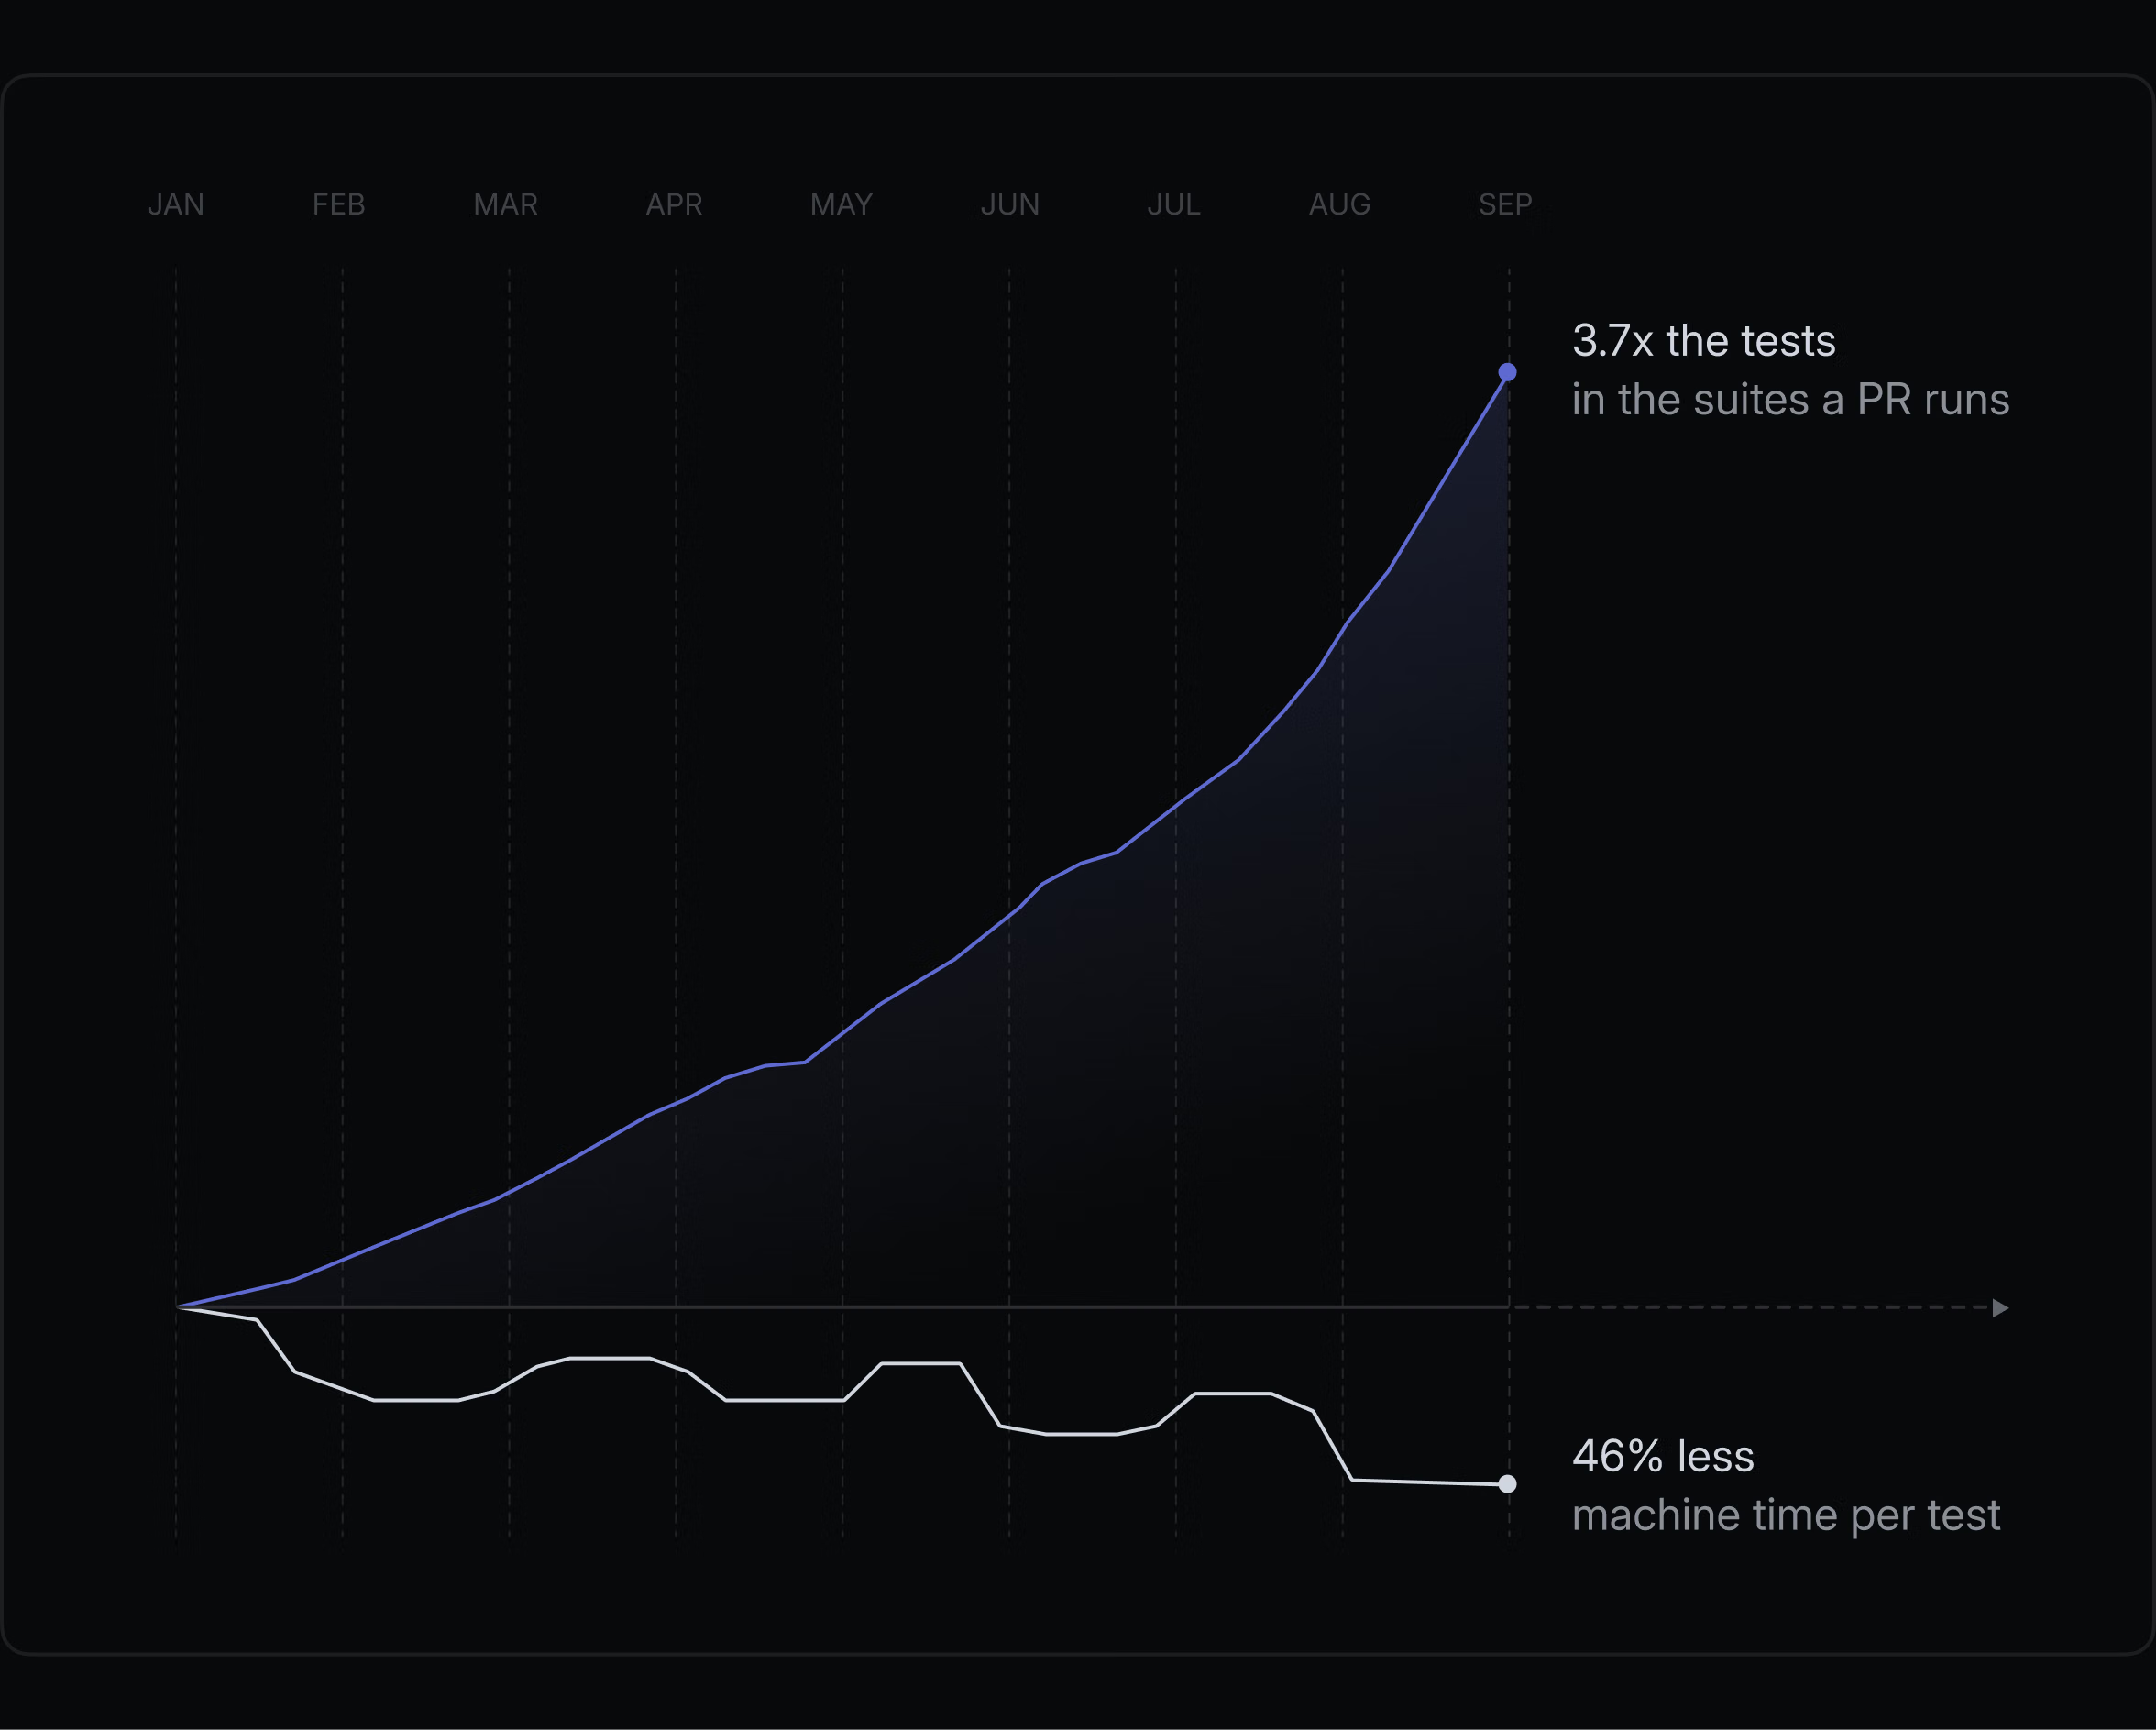
Linear's test suite has grown nearly 4x year-to-date, yet PR wait time for CI has actually gone down.
Coding got faster, so why are PRs slower? Because every PR still has to run through CI (Continuous Integration—the pipeline that automatically runs tests, compiles code, and builds the project after every commit). Agents have driven the cost of producing code close to zero, but validation hasn't kept up—so the queue piles up at CI.
Earlier this year, Linear engineer Mufeez Amjad opened his board to find a ticket already assigned by CTO Tuomas, with a one-line title: "CI costs are too high." Followed by a second line: make it faster too, while you're at it.
They were tracking two things: how long a PR (Pull Request—a mechanism where a developer submits changes to the main branch and requests they be merged in) waits on CI, and how much runner time it burns. Test volume kept doubling; both those lines had to come down—the four categories of moves that made it happen are broken down below.
New machines, new compiler: compress the slowest single points first
All three moves happen outside the pipeline's structure: faster runners, a native compiler, and decoupling lint from TypeScript type information. Each saves time for a different reason.
Linear's first cut was at the machines themselves. They migrated their workload from GitHub Actions to a third-party runner—faster CPU, smoother storage, more reliable caching. No code changes, no config changes; the same pipeline on faster hardware, and the slowest individual tasks were compressed first.
The second cut was the compiler. Linear is almost entirely TypeScript, and tsc (the official TypeScript compiler, which checks types file by file) was a weekly bottleneck. tsgo (TypeScript's native compiler, rewritten in Go for faster startup and single-pass checking) saves time for a straightforward reason: type checking is CPU-intensive work, and rewriting it in a compiled language cuts the fixed overhead of a single pass. Once type checking stops being the bottleneck, the pipeline's wait point shifts accordingly.
The third cut was lint. Linear had a batch of custom rules that depended on TypeScript type information—either for constraints or for autofix (where the editor or tool automatically rewrites code per a rule). Every lint run had to build the full type graph first, which made lint one of the most memory-hungry jobs in CI. Building the type graph was the root of the slowness.
The team rewrote these rules to do static analysis on the Abstract Syntax Tree (AST—a tree structure that breaks code into its smallest syntactic units like functions, ifs, and returns), sidestepping type information entirely. ESLint was thus fully freed from its TypeScript dependency, and memory usage dropped along with it.
A side benefit: later migrating to Oxlint (an extremely fast linter written in Rust, focused on syntax-level rules) became much easier—syntax-only rules could be ported directly without dealing with type coupling. After Oxlint came online, lint runner-minutes (total billable time for CI machines) were pushed down even further.
What was blocking 8 shards wasn't the tests—it was a 26-second gate in front of them
New machines and a new compiler (tsc→tsgo) crushed individual job times, but whether PRs can wait less on CI depends on the "small gate holding everyone up." When Linear lifted the view from a single job to the pipeline as a whole, the bottleneck was hiding in the change detection job that everyone runs in front of.
Every pipeline starts with a change detection job: it figures out which paths the PR touched and whether database-related checks need to run. 8 API test shards (splitting tests into multiple pieces that run in parallel) are all waiting for its signal; if it stalls one second, all 8 shards start one second late.
Yet this job was doing unnecessary work: even when only one or two files changed, it would pull the entire working tree (a complete copy of the codebase). Median 26 seconds; the worst case stalled 94 seconds—a gate that only does a check, slower than any test it was supposed to release.
Linear's first move was setting a depth limit on fetch (capping how far back history is pulled), compressing the worst case from 94 seconds to 20. Second, they removed checkout entirely—some gating jobs don't need the working tree at all, so the time dropped from 27 to 7 seconds. Third, for flows that genuinely need diff (comparing code changes) paths, they switched to sparse checkout (only fetching the directories needed), saving another 11-plus seconds.
The previous section covered how tsc, lint, and tests individually got faster. But there's a more hidden gate: where the cache marker gets written. Linear had originally written the cache marker inside "the last check before merge," so even when all tests passed, the PR had to sit idle in the merge queue (the line of PRs waiting to be merged) waiting for that write. Moving it to a non-gating job shaved 42 seconds off the merge path.
Gating jobs are worth tackling first—if they're really on the critical path. Once they're off the critical path, further tweaking them is pointless.
node_modules cache killed: sometimes not caching is faster than caching
An engineer's instinct is to cache everything that can be cached. Linear tried it and found node_modules is an exception: a cache hit was slower than a fresh install, so they tore out the cache.
Their reasoning was simple: line up node_modules cache hit rate, hit time, and fresh install time. A cache hit still took 28 seconds; installing without the cache took 7.5 seconds. The gap was too large for the cache to justify its existence—so they killed it. If you build or modify CI, run the same comparison yourself: if hits are slower than misses, the cache should come out.
This points to a broader trend: AI coding densifies code changes, and CI's bottleneck shifts from "running too long" to "slow startup, too much repetition." Every PR pipeline has to pull dependencies, clone code, and connect to a database before it starts; these costs are fixed, whether this change is one line or one file.
Pre-installing the Postgres client into the base image, narrowing API package installs to only what's needed, and dropping the node_modules cache all compress this fixed overhead.
Only a few moves are copy-pasteable; understand the rest first
Linear's full optimization is team-specific engineering. Only a few moves drop directly into your own pipeline.
Two you can do right away. In the API workflow, pnpm install originally took 44 to 73 seconds; narrowing the install scope to the API package and its dependencies compressed it to 16 to 18 seconds—a single-job-level change with a low bar to entry.
The other is the Postgres client: each shard (test shard) used to spend 7 to 8 seconds installing it via apt; baking it into the CI base image made that cost vanish. Both came from the primary source's own review of their setup phase.
Others are more systemic and worth weighing before copying. The 34% speedup from switching to a third-party runner assumes GitHub Actions is already your bottleneck; if it isn't, migrating may not pay off.
Switching to tsgo (the native TypeScript compiler) is a more aggressive toolchain swap and depends on your team's tolerance for compiler version changes. Architectural changes like moving the cache marker from a pre-merge job to a non-gating one also require understanding what's actually on your own critical path—Linear's move cut 42 seconds off the merge path, but that's specific to their pipeline structure.
Measure your own PR CI wait median and p90; pin down exactly where it's stuck with numbers before deciding which job to touch.
In your API or backend workflow, find the dependency install step and compare actual times across "full install," "filtered install," and "cache hit"—using Linear's logic for killing the node_modules cache.
Bake runtimes every shard installs via apt (Postgres client, database drivers, etc.) into the base image and save a few seconds of repeated installs per shard.
Check the critical path for small jobs that "must finish before others can start" and add timeouts and retries, so a single hiccup doesn't stall the whole pipeline.
For system-level moves like switching runners, swapping compilers, or relocating cache markers, A/B test on a non-critical workflow for two days first—compare median and p90 before committing.
Source: Linear Blog, "AI coding has made CI a bottleneck, so we reworked ours to keep up" (2026-09-21). Scope note: Data comes from Linear's own engineering team's review of their own CI pipeline—a vendor-reported internal optimization result—and does not constitute a cross-team or cross-toolchain comparison.